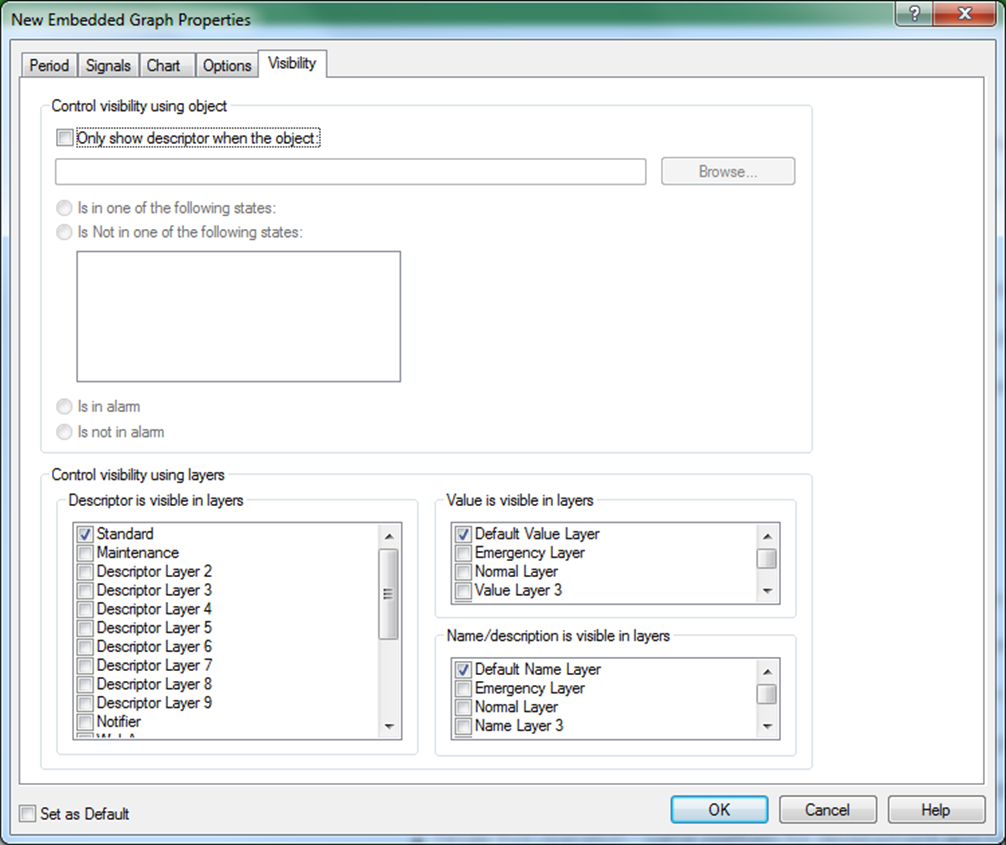
For an embedded graph you can also define when and how it will be shown as part of a diagram e.g. inside a descriptor such as a tank or a machine. Graph visibility is defined in the New Embedded Graph Properties form’s Visibility tab, where visibility parameters are set in the same way as for other descriptors.
For an Embedded Graph2, displayed in a diagram, right-click on the graph and select Properties…
1 You can also select the graph in the Definition module’s Graph menu if the graph is accessible from that. If you are creating or editing a graph, the Graph Properties form will already be open.
2 Note that in the Embedded Graph Basic form graph properties are organized differently with fewer options.

In the New Embedded Graph Properties form > Visibility tab:
In the Control visibility using object group:
Select Only show descriptor when the object: if you prefer that the graph is only visible in the diagram under certain conditions.
Click Browse to open the Object Browser form and select the object, for which you want a condition to determine whether or not the Embedded Graph is to be visible (only one object can be assigned). A visibility object can be a digital, analog, counter, string or table object as well as an area or a diagram.
Specify which one of the Visibility conditions must apply in order for the Embedded Graph to be displayed:
Is in one of the following states (Digital objects only): The graph will only be displayed when the state(s) of the selected digital object corresponds to the any of the states in the selected check boxes. These appear when the object is selected under step B.
Remember there is a 32-state upper limit to the number of states you can name in the Digital Object Template.
Is NOT in one of the following states (Digital objects only): Similar to the above.
Is in alarm (Analog, Digital, Counter, String, Table objects, area and diagram: The graph will be displayed when the selected visibility object (step B) contains an active alarm - acknowledged (i.e. the alarm condition still exists) as well as unacknowledged).
Is NOT in alarm (Analog, Digital, Counter, String, Table objects, area and diagram: The graph will be displayed when the selected visibility object does NOT contain an active alarm acknowledged or unacknowledged alarm.
The Control visibility using layers group allows you to assign a graph to a given layer, so that the graph – maybe together with other descriptors in the same layer - is only displayed when that layer is in a given condition. This function is typically not used for graphs.
If you want to set up additional graph properties, click one of the other tab pages to continue graph set up:
TIP! You can set the present graph properties as the default parameters for all future graphs by selecting the Set as Default check box.
See Also
Set graph properties as default values
Create a new graph in a separate window
Define the visibility of embedded graphs
Create and edit an Embedded Graph Basic
Connecting objects to each other
Reference a graph from a symbol