Open topic with navigation
What is a graph?
A graph displays variations in object states or values with respect to time and can facilitate gaining a quick overview of the characteristic behavior of selected key process components.
Operators can use a graph to:
- Get a graphical
overview of the values and performance of one or more process components to evaluate their states over time
- Detect adverse
trends at an early stage
- Monitor the
effect of interventions by combining historical graph data with current
process values
IGSS graphs are capable of combining current trends and historical data in the same chart, enabling the operator to see at a glance what happened in the process just before and immediately after an intervention or incident.
Supported object types
A graph chart can contain values or states of up to 16 signals. A signal can be an IGSS object .
All values and states from Analog, Counter, Digital and Table object types can be displayed in a graph.
The data source can be log data, (*.log), reduced data (*.bcl), HourDayMonth data () or a combination of the data types. Live object data can also be displayed in the graph.
Graphs in IGSS are considered to be Container objects (auxiliary objects) and can be referenced as objects using descriptors such as buttons, rectangles or the graph object symbol.
The IGSS Object-Level Protection feature can also be applied to a Graph, helping to prevent unauthorized users from opening the graph.
Different types of graphs
There are different graph types in IGSS:
A predefined graph is created in advance by the system designer in the Definition module, and can be edited, maintained and deleted by anyone with system designer user rights. The operator can access predefined graphs in the Supervise module from the Graph menu or by clicking on a such as symbols, buttons, images and clickable areas representing the graph in a process diagram.
Graph properties can be edited by the operator during supervision for temporary use, but the changes to the predefined graph will not be saved when the project is closed. However, the operator can use a pre-defined graph as basis for creating an Operator Graph with the same or changed properties and save it on the operator’s own local pc as a user-defined graph. Only people with access to this pc will be able to open, edit and delete it.
There are two types of predefined graphs:
Graphs created and displayed in a separate window (not part of a process diagram), also referred to as Standard Graphs. The Graph menu displays all available predefined Standard Graphs in the active area, provided that system engineer has selected the Name to Menu or Description to menu option. This is done in the Window tab of the New Graph Properties form.
If the graph is displayed with a check mark in the Graph menu, the graph is open.

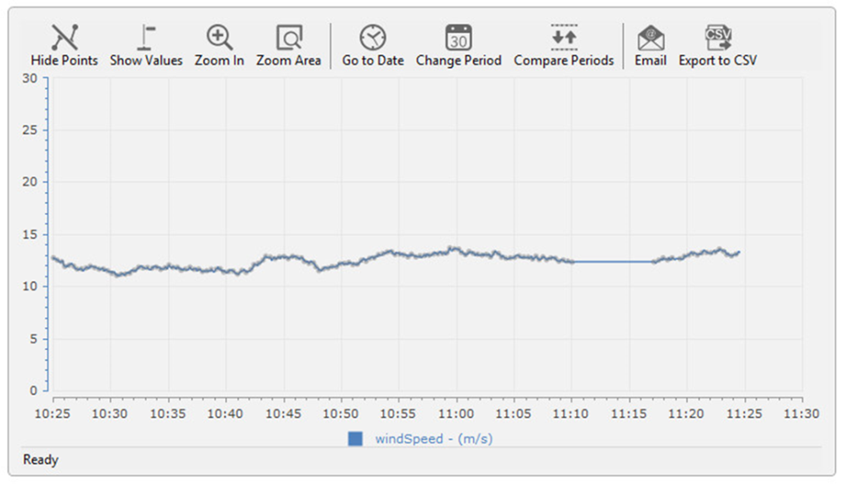
Example of a Standard Graph in a separate window.
- Embedded Graphs are displayed as an integrated part of a process diagram e.g. as part of a specific descriptor or object. These can only be created, defined, edited and deleted by the system designer in the Definition module.

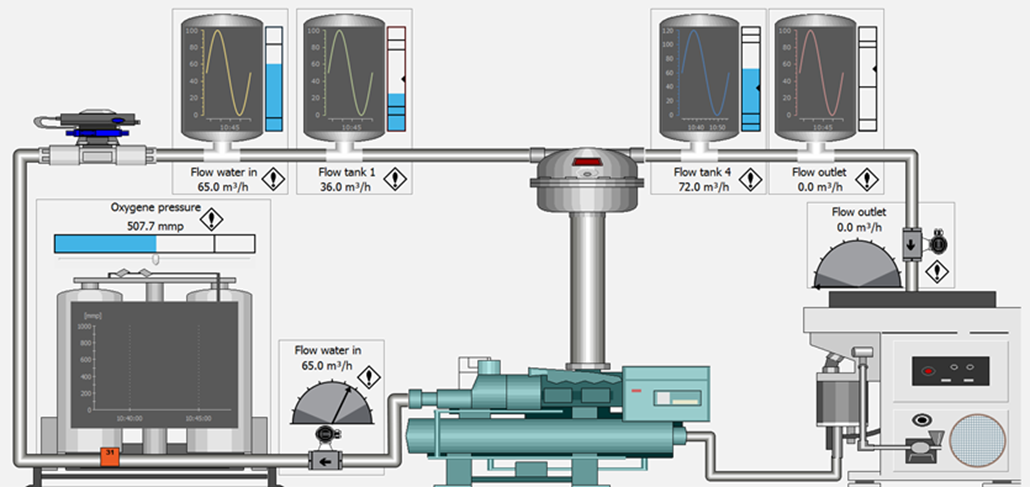
Example of process diagram with 5 embedded graphs.
Operators are able to view Embedded Graphs in the Supervise module. Here, the operator can adjust some graph properties for temporary use, but these will not be saved. Once a diagram with an Embedded Graph is closed, it will reopen with the pre-defined graph properties, set in the Definition module by the system designer.
An Operator
graph is a graph created on-the-fly by the operator during in the Supervise module during supervision. In the Supervise diagrams, the operator selects which IGSS objects to include in the graph and
then selects Graph ® Create
Operator Graph. This function is very useful, if the operator wants
to monitor a specific process component before and after an intervention.
The Operator graph can be saved as a user-defined graph (*.usr) on the local work station. When re-opened,
the graph will be dynamically updated. User-defined Operator Graphs are not displayed in the Graph menu in Supervise.
Kindly refer to the help in the IGSS Supervise module for more information on how to create and use the Operator Graph.
Dashboard graphs are created and displayed in the Dashboard module, which is used to provide the operator with a quick overview of the process by combining different data representations in one view.
Dashboard graphs are simpler with much less design and navigation options than the other graph types. They can be created and maintained by both the System Designer and the Operator in the Dashboard module using the Graph Widget. For more information on how to create and navigate Dashboard Graphs, kindly refer to the IGSS Dashboard module help.

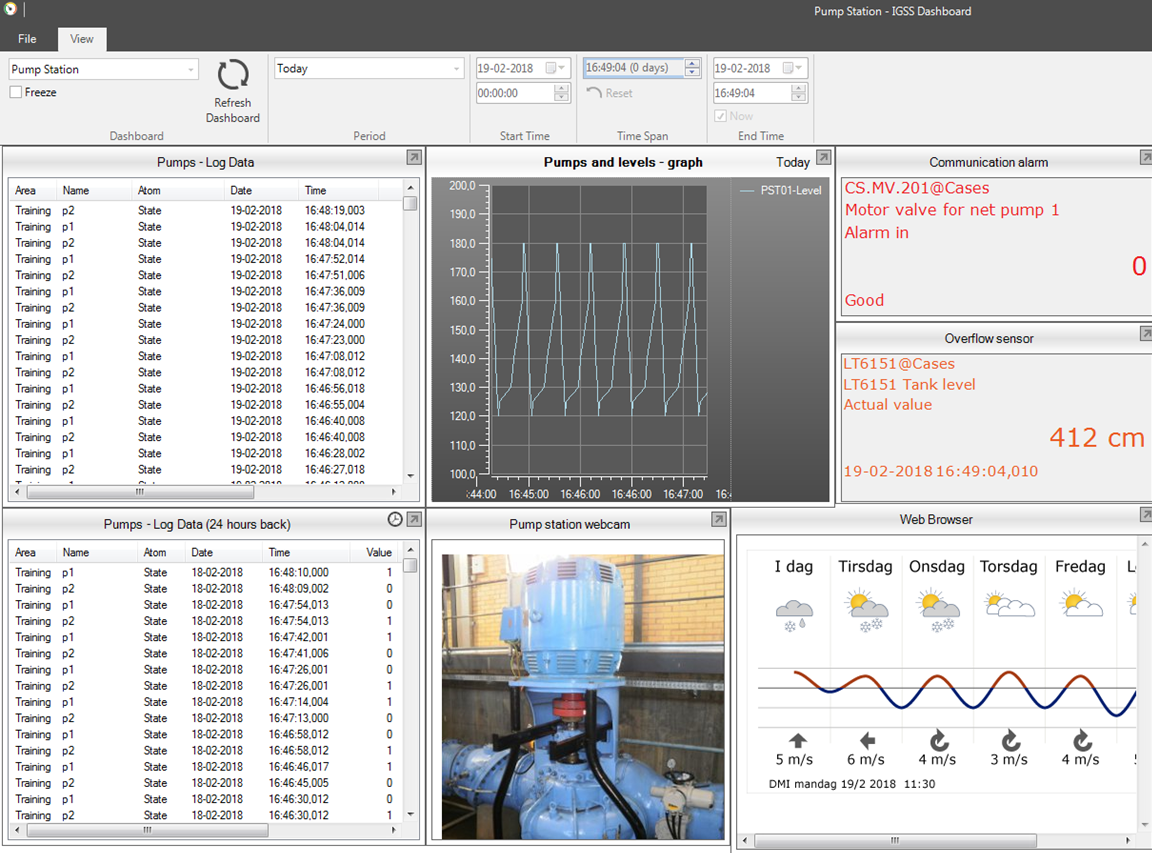
Example of Dashboard Graph, a typical part of a Dashboard quick overview window.
Graph menu
The Graph menu displays all available
Standard graphs in the active area provided that the Name
to Menu or Description to menu option is selected for each graph. If the graph is displayed with a check mark in the Graph menu, the graph is open.
Graph properties
When you create a graph, you specify a number of properties using the
Graph Properties form, which is identical for all types of graphs (with a few exceptions)*:
- Window properties incl. name to menu, protection etc. (predefined Standard Graphs only; Can only be defined by the system designer in the Definition module)
- Period and duration to be displayed in the graph
- Signals as input values in the graph, usually an object (atom), and graph axis
- Chart appearance such as legend, object/atom information etc.
- Options such as chart colors, graph tool bar, show/hide data points and values etc.
- Visibility of embedded graphs e.g. according to object states (Predefined Embedded Graphs only; Can only be defined by the system designer in the Definition module).
The properties of pre-defined graphs can be changed at any time by the system designer in IGSS Definition. User-defined Operator Graphs can be changed in IGSS Supervise.
For detailed information on how to create and navigate graphs, define properties, etc., kindly refer to the How to …. guides in the Help section.
*An Embedded Graph Basic, used in older versions of IGSS, is also available, mainly for editing of already existing graphs. This is operated differently and provides much less options. The same is the case for the Dashboard Graph.
See Also
Graph Properties Form
Create a new graph in a separate window
Create an Embedded Graph
Create and edit an Embedded Graph Basic
Dashboard Graph Widget
Set graph properties as default values
Open topic with navigation


