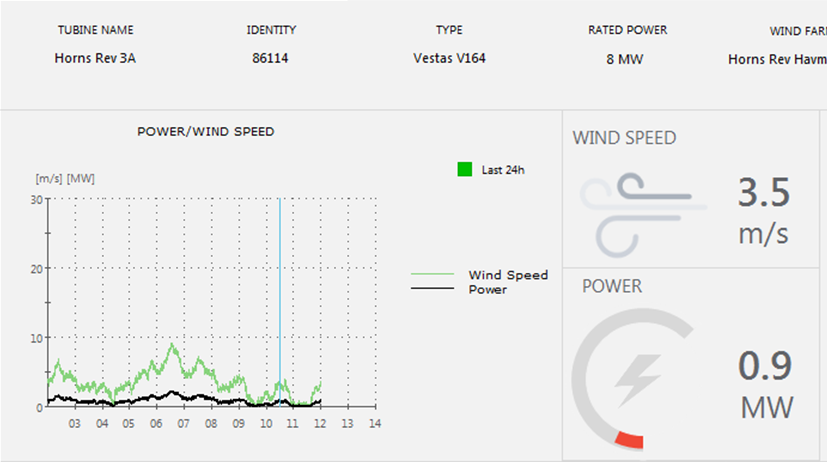
An Embedded Graph Basic is displayed as an integrated part of a process diagram e.g. as part of a specific object or descriptor, and is created in the Definitionmodule.

In the Supervise module the operator has the option to zoom in, change graph period and scale as well as print graphs. It is not possible to e-mail an Embedded Graph Basic or save it as an Operator Graph.
Please note that the Embedded Graph Basic offers less features than the default Embedded Graph, e.g. it is not possible to set graph properties as default values. In addition Operators are able to edit all the properties of default Embedded Graphs in the Supervision module. This is not possible for Embedded Graphs Basic, where properties only can be changed by a system designer in the Definition module.
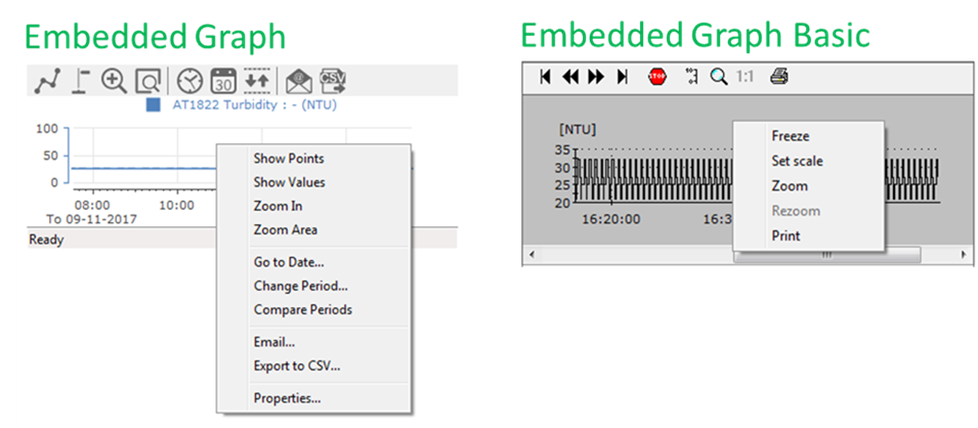
To integrate a new Embedded Graph Basic in a diagram, you have to create and set up all the graph properties in the Definitionmodule.
Right-click on the location or descriptor, where you want the graph. Select New > Standard Descriptor > Embedded Graph Basic, or
Click the Objects menu in the tool bar at the top of the Definition module and select Standard Descriptors > Embedded Graph Basic
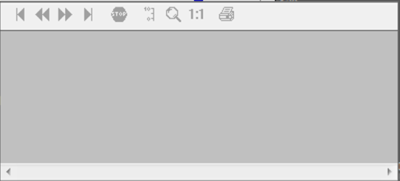
An empty graph is now inserted in your diagram, where you can move it to the desired position.
Double-click inside the Embedded Graph Basic – or right-click and select Properties… - to open the Embedded Graph Basic Properties form. Here you attach objects and define graph parameters such as period, colors, general chart and interface options etc. in the different tabs of the form.
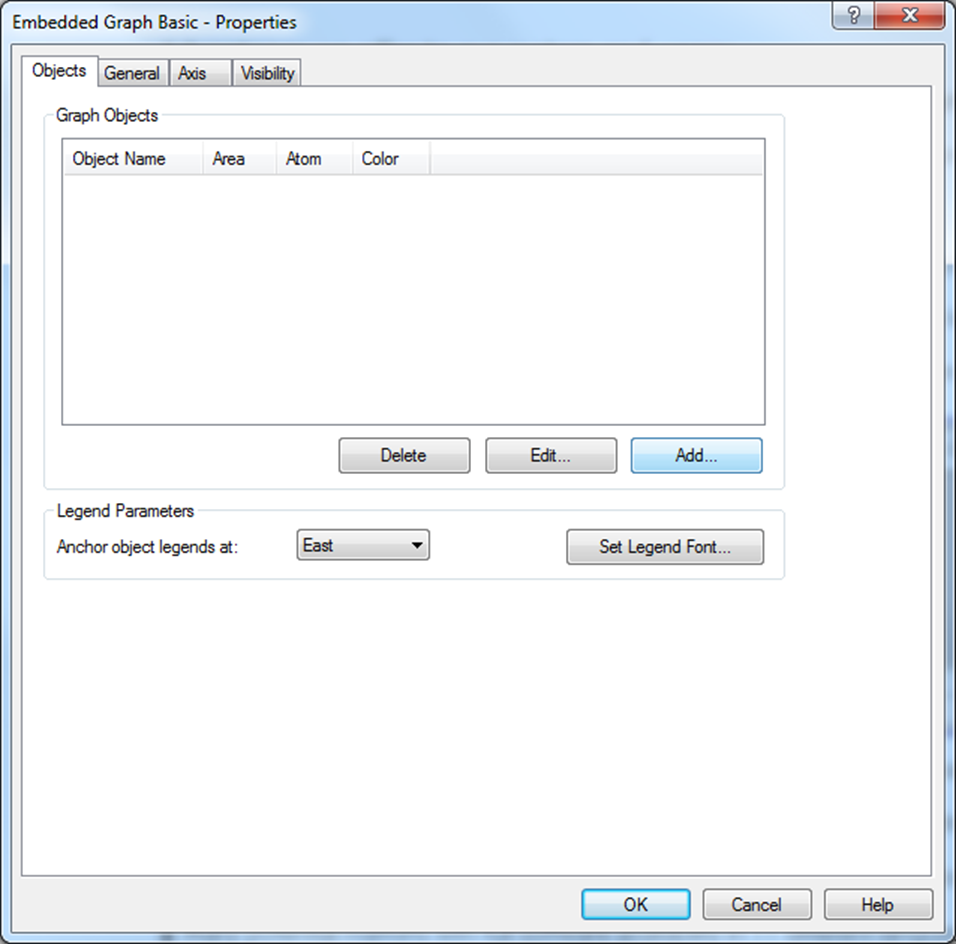
Add Graph Objects
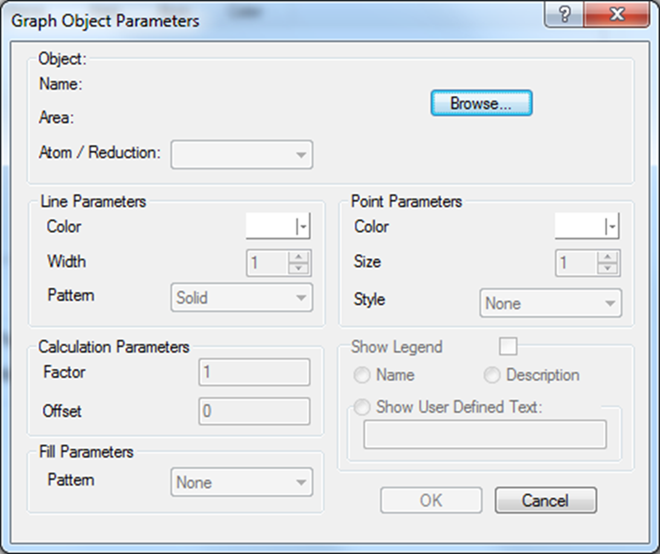
In the Graph Object Parameters form, click the Browse button to open the Object Browser form.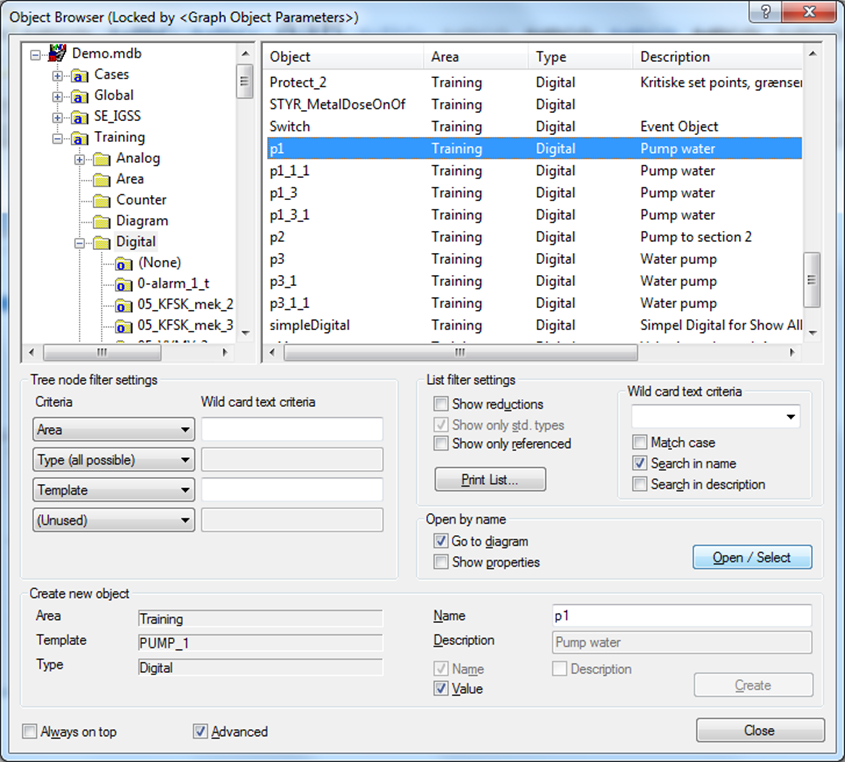
In the Object Browser form, select the Object you want to create a graph signal, click Open/Select to add the object to the graph and Close the Object Browser form.
In the Graph Object Parameters form, define the parameters for how you want to display the selected object’s signal in the graph:
Under Line Parameters, select the color you want to represent the signal line in the graph plus the line width and pattern (dotted, long/short dash).
Signal lines in a graph are as default shown as a line with no measuring points. Point Parameters allows you to display the individual graph points, each representing a data value retrieved from the data source (LOG, BCL or Live data) as gray dots on the signal line. You can also define another color, size and style for the displayed data points.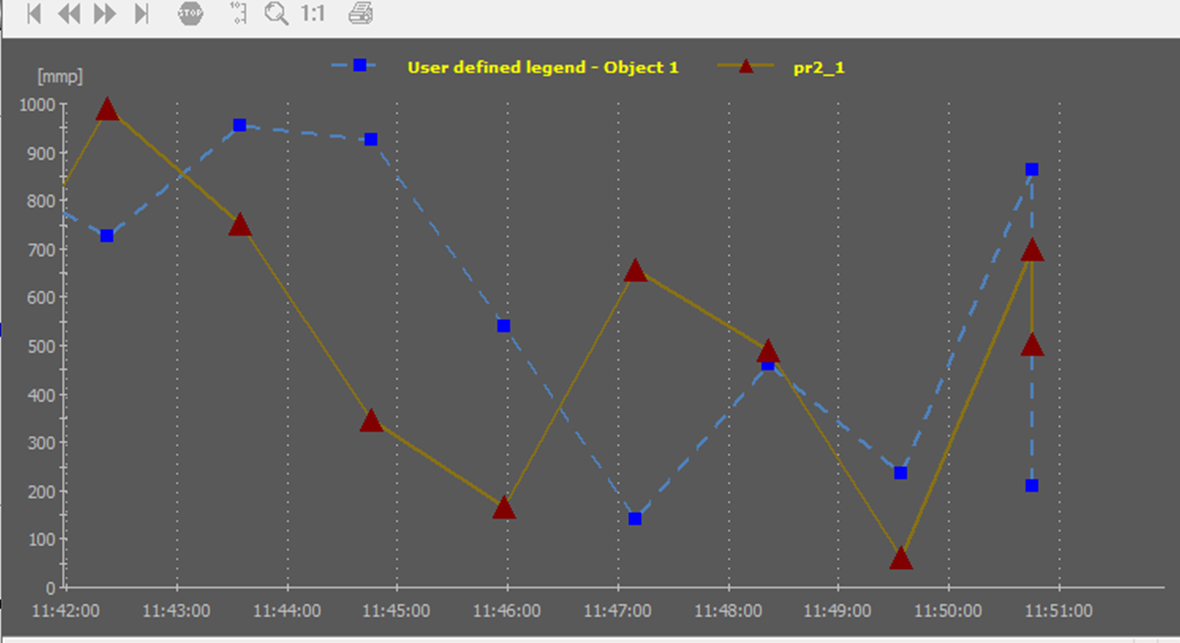
Decide whether or not to Show Legend (either Name or Description or a User Defined Text) for the actual signal.
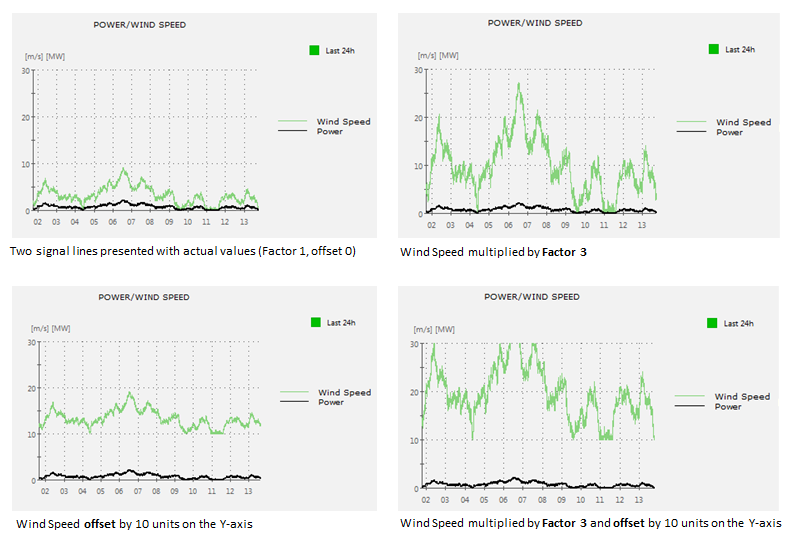
Calculation parameters can make it easier to study graph trends e.g. if signal values for two or more objects normally are very close to each other (typically in the lower value range) so you cannot distinguish one from the other. You can create a distance between the signal lines in two ways:
Multiply the actual Y-axis value of a signal by entering a Factor
Offset a signal from the other(s) by a number of units on the Y-axis.
When a graph is presented using Calculation Parameters, the Signal Legend needs to include User Defined Text about the factor and/or offset value so the operator knows that a signal is displayed this way.
Fill Parameters allows you to add a pattern for the part of the graph below the signal line. Default pattern is a dotted background in 25, 50 or 75% of the selected line color but you can also select stripes.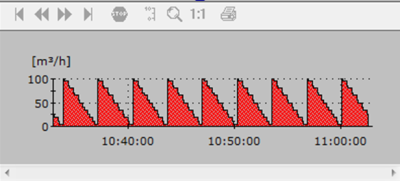
At the bottom of the Graph Object Parameters form, select where to Anchor Object Legends and which Legend Font to use.
In the General tab of the Embedded Graph Basic Properties form you can define a variety of graph parameters.
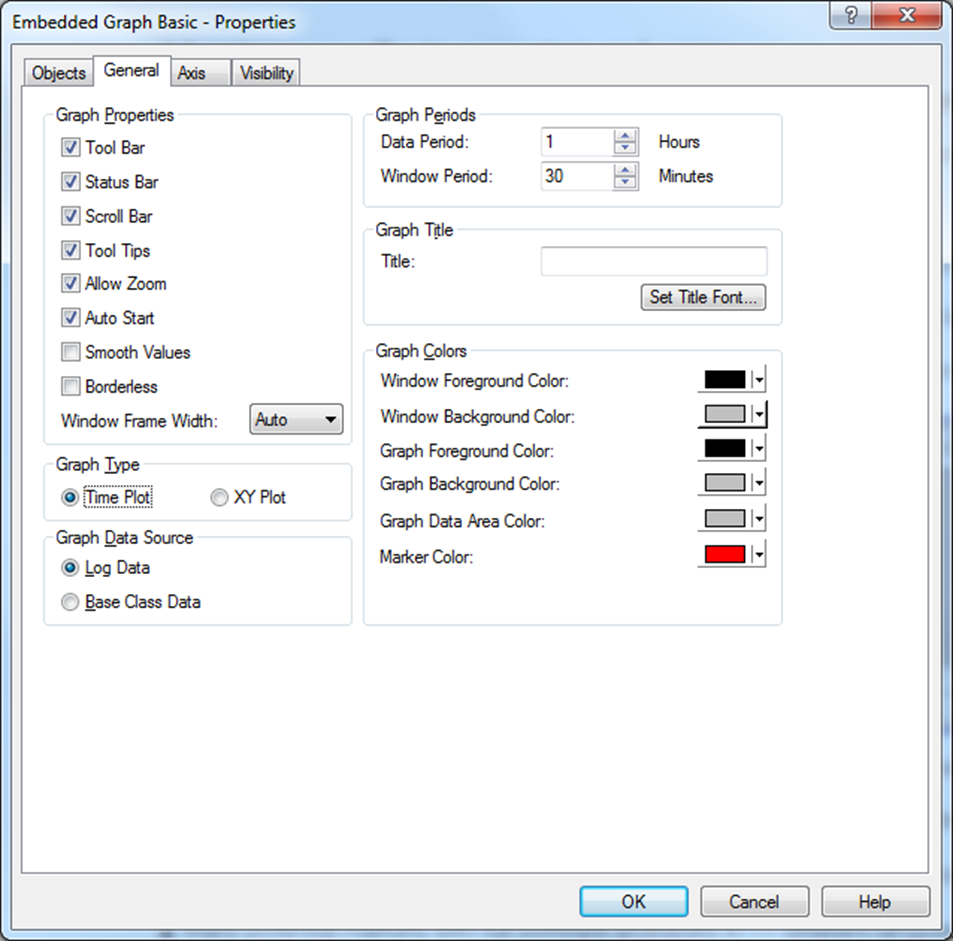
Data Period: Select the data period (hours) included in the graph.
Window Period: Select the time period (minutes) displayed at a given place of the embedded graph.
Add a Graph Title: Enter an optional name for the embedded graph and select a Title Font.
Define the different Graph Colors and Window Colors (Foreground, Background) plus Data Area and Marker Colors.
Select Graph Type:
Select Time Plot to plot the object values according to a time interval (see graph examples above).
Select XY Plot (scatter plot) to plot the object values according to each other. This is only relevant for Table Objects, typically used to represent a process component that can take on any value within a specified range, or a single Table Object used for up to ten different analog objects that belong together in some way.
An XY Plot has points that show the relationship between two sets of data (X and Y values). Data points can be connected with lines. An XY Plot can e.g. be used to visualize the performance of a give object (e.g. machine component) and how it influences other process parameters at different performance values.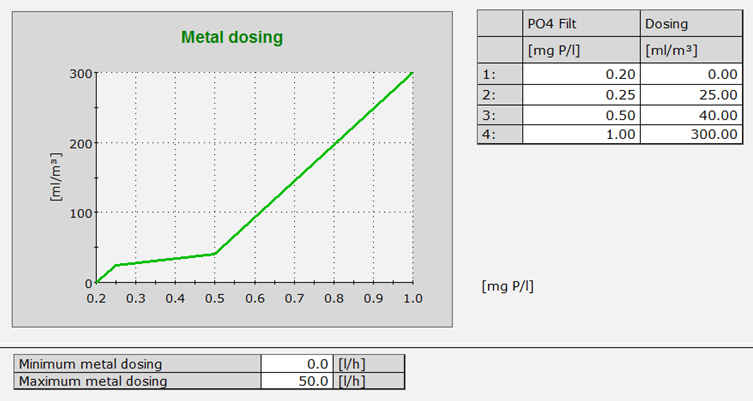
Select a Graph Data Source for all object signals in the graph:
Log Data: The graph loads any available LOG data. If an atom (signal) does not save object data in LOG files, the graph line will not display anything for that signal.
Base Class Data: Historical data processed by the system on the basis of the seven built-in formulas (Average, Minimum, Maximum, Sum, Actual, Change and Difference).
You will receive an error message when you run the graph if IGSS cannot access the relevant data sources (LOG or BCL) to populate the graph.
The IGSS project can be set up in the System Configuration form > Files tab to automatically delete old LOG and/or BCL files.
Select additional Graph Properties for the appearance and user interface of the Embedded Graph Basic:
An Embedded Graph Basic is as default created with Tool Bar, Status Bar, Scroll Bar, Tool Tips*, Allow Zoom and Auto Start (automatically starts the graph creation when the diagram is opened). Remove the check mark in the box if you want to deselect any of these.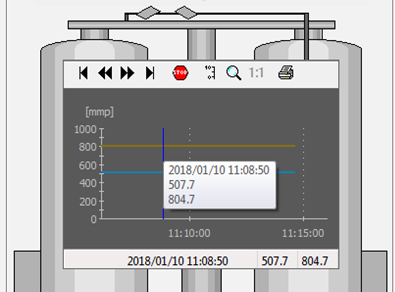
* Embedded Graph Basic with Tool bar and Status Bar plus Tool Tips (white box showing date, time and values during mouse over of the signal lines.
An Embedded Graph Basic is as default created with straight lines connecting the individual data points.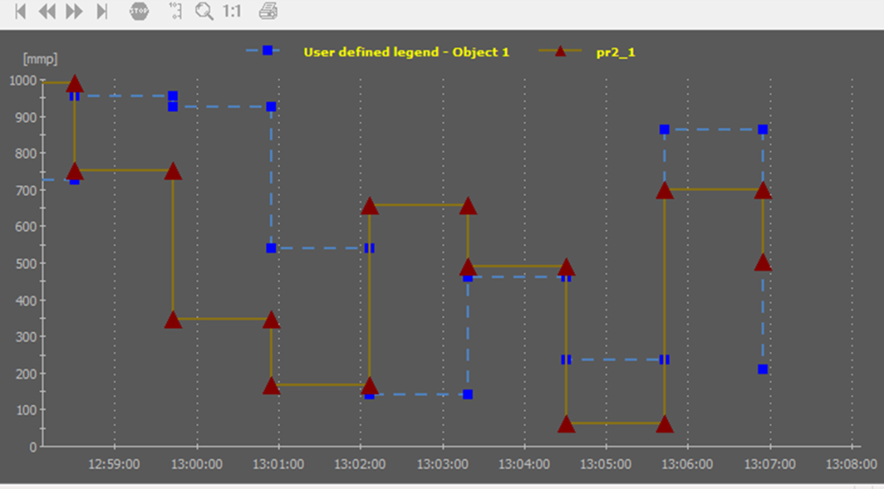
Select Smooth Values if you want the graph to be presented with smooth lines in stead of straight lines.
A default Embedded Graph Basic has a border but you can also select Borderless.
You can also define the Window Frame Width (distance from the graph’s border to its content).
In the Axis tab you can define parameters for the X-Axis (time) and Y-Axis (Values). The X-axis is only used when the XY Plot type (relevant for Table Objects) has been selected in the General tab.
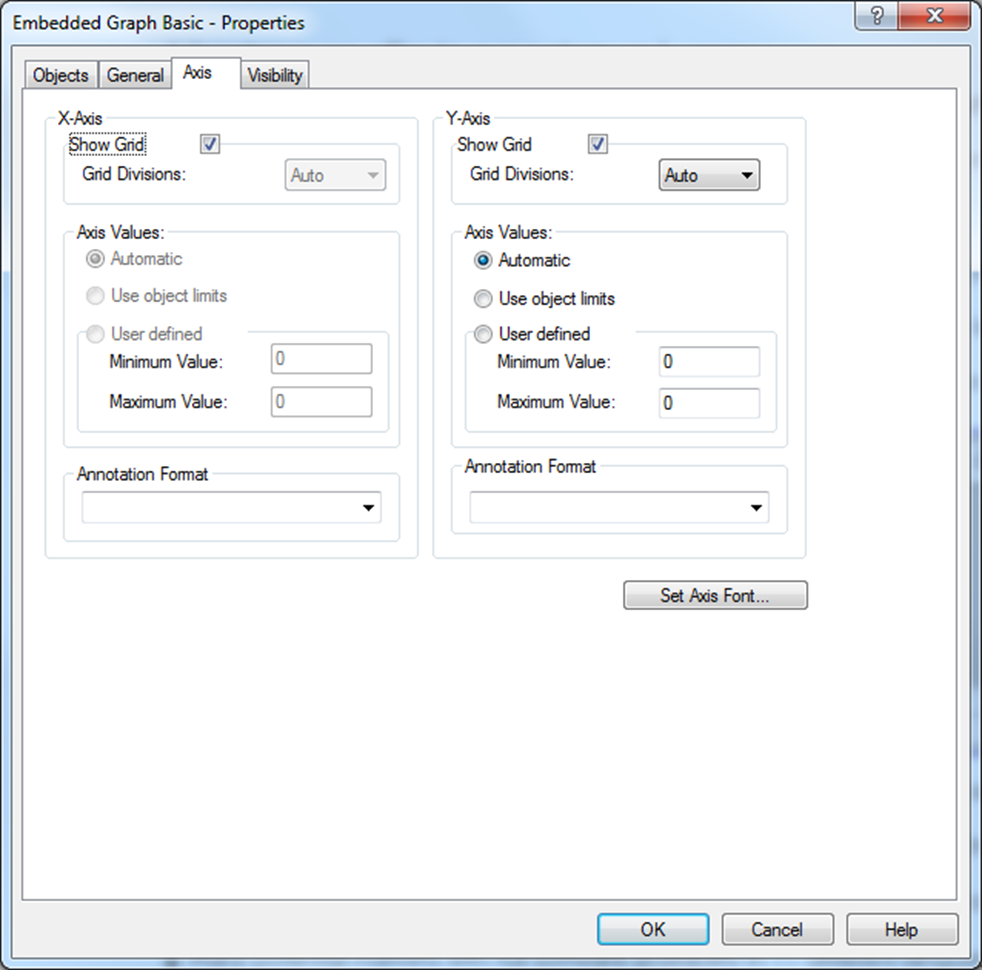
Under Axis Values you select the value interval for the Y-Axis. This can automatically be defined or you can manually specify an interval. For XY Plot graphs (relevant for Table Objects) you can also specify X-axis values.
Under Annotation Format choose a format for how to:
Present the values along the Y-Axis such as decimals or in scientific format (displays a number in exponential notation, replacing part of the number with E+n, where E = Exponent multiplies the preceding number by 10 to the nth power. For example, a 2-decimal scientific format displays 12345678901 as 1.23E+10, which is 1.23 times 10 to the 10th power.)
Present the date and time format on the X-axis.
You can also modify the Axis Font.
In the Visibility tab you can define the graph’s appearance inside the diagram.
In the Control visibility using object group:
Select Only show descriptor when visibility object if you prefer that the graph is only visible in the diagram under certain conditions.
Click Browse to open the Object Browser form and select the object, for which you want a condition to determine whether or not the Embedded Graph is to be visible (only one object can be assigned). A visibility object can be a digital, analog, counter, string or table object as well as an area or a diagram.
Specify which one of the Visibility conditions must apply in order for the Embedded Graph to be displayed:
Is in one of the following states (Digital objects only): The graph will only be displayed when the state(s) of the selected digital object corresponds to the any of the states in the selected check boxes. These appear when the object is selected under step B.
Remember there is a 32-state upper limit to the number of states you can name in the Digital Object Template.
Is NOT in one of the following states (Digital objects only): Similar to the above.
Is in alarm (Analog, Digital, Counter, String, Table objects, area or diagram): The graph will be displayed when the selected visibility object (step B) contains an active alarm - acknowledged (i.e. the alarm condition still exists) as well as unacknowledged).
Is NOT in alarm (Analog, Digital, Counter, String, Table objects, area or diagram): The graph will be displayed when the selected visibility object does NOT contain an active alarm acknowledged or unacknowledged alarm.
The Control visibility using layers group allows you to assign a graph to a given layer, so that the graph – maybe together with other descriptors in the same layer - is only displayed when that layer is in a given condition. This function is typically not used for graphs.
The pre-defined properties of an Embedded Graph Basic can at any time be edited in the Definitionmodule:
Right-click inside the graph and select Properties… at the bottom of the menu.
The Operator can edit the graph start time and period plus the maximum and minimum values of the Y-Axis in the Supervise module, either temporarily or permanently by selecting the Use default check box.
It is possible to lock an Embedded Graph in a given position e.g. to protect it when you are working with other descriptors, groups etc. in the diagram. When locked, it is not possible to change the Graph Properties.
To lock an Embedded Graph, place the mouse over the graph and either do Ctrl + L or right-click and select Lock from the menu.
To unlock an Embedded Graph, there are two ways:

Tip: It is possible to sort the list according to Locked state in ascending or descending order by marking and right-clicking the header of the Locked column, to make locked descriptors (Yes to locked) appears first.
See Also