Open topic with navigation
Graph Properties Form
Use the Graph Properties form to define the graph period, the object atoms and appearance of the graph line, the data source to be displayed in the graph, the graph title, font properties for all graph texts and other parameters.
You can also set up the graph legend properties and chart colors, enable display of the graph toolbar and status bar as well as decide if to hide time and value labels and scale.You can select up to 16 signals that can consist of any object atoms which contain data (LOG, BCL or Live data) from the following atom types:
Signals
A graph usually contains at least one signal, which can be any object atom which contains data (LOG, BCL = Base Class files and/or Live data).
You can select up to 16 signals that can consist of any object atoms which contain data (LOG, BCL or Live data) from the following atom types:
-
Analog
-
Digital
-
Table
-
Counter
Preconditions
Where do I find it?
-
To create a new graph in a separate window (Standard Graph): In top menu of the Definition module, select Graph -> Create Graph…
-
Existing stand-alone graph (Standard Graph):
If open, right-click on the graph and select Properties… If not
Select the graph in the Graph menu if it is already accessible there first. If not,
Click Graph -> Open in the top menu to open the Object Browser form. In the right pane of the Object Browser form, select the graph you want to edit. Click the Open/Select button to open the graph and the Graph Properties form.
-
To create a new Embedded Graph presented as part of a diagram:
Right-click in the diagram and select New -> Standard Descriptors -> Embedded Graph or Embedded Graph Basic, or
In the top menu, select Objects -> Standard Descriptors -> Embedded Graph or Embedded Graph Basic, or
In the Drawing Toolbar select the Embedded Graph drawing tool  .
.
-
Existing Embedded Graph: Right-click on the graph and select Properties.
Tab Overview
The Graph Properties form is identical for all types of graphs with a few exceptions as indicated in the content below. The Graph Properties form for the Embedded Graph Basic is different – see "Create and edit an Embedded Graph Basic".
Window tab
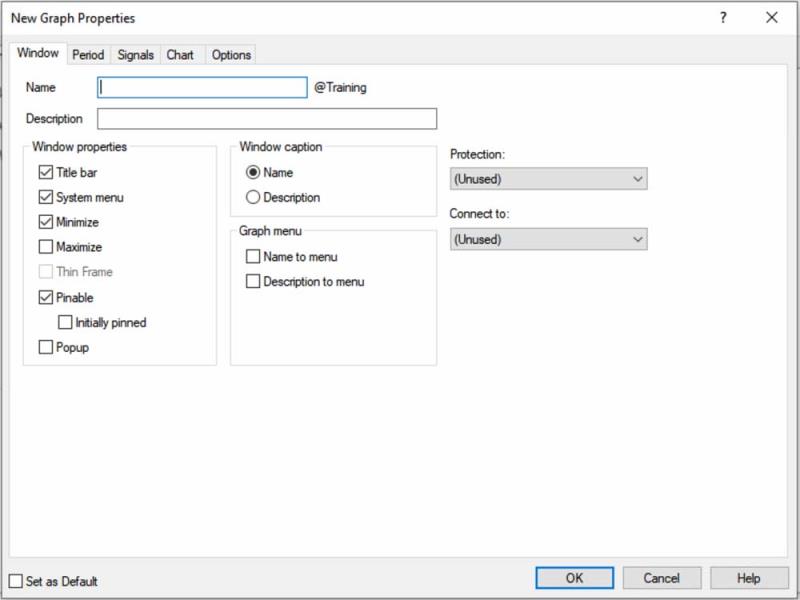
On this tab page (Predefined Standard graph) you can:
-
Enter the name and/or description of the graph
-
Set up the graph window properties
-
Define how the graph is displayed in the Graph menu
-
Connect the graph to other objects
-
Enable object-level protection for the graph
For further info about creating a graph please refer to "Create a new graph in a separate window"
Period tab
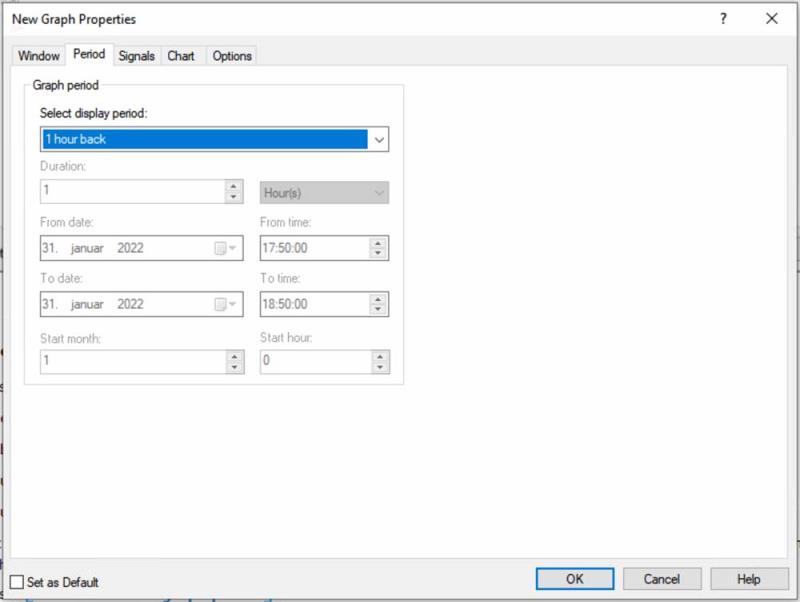
On this tab page you can select the graph period to display:
-
Relative periods (hours, days, weeks, months and year back)
-
Absolute periods (Today, Yesterday, This/last week, month, year)
-
Custom durations (X hours, days, months back)
-
Custom periods, where you define the start and end dates and times of the graph.
-
It is also possible to add a user-defined Start Hour, if you select an absolute period (Yesterday, this or last week/month/year), and Start Month if you select This Year.
For further information please refer to "Define a default graph period"
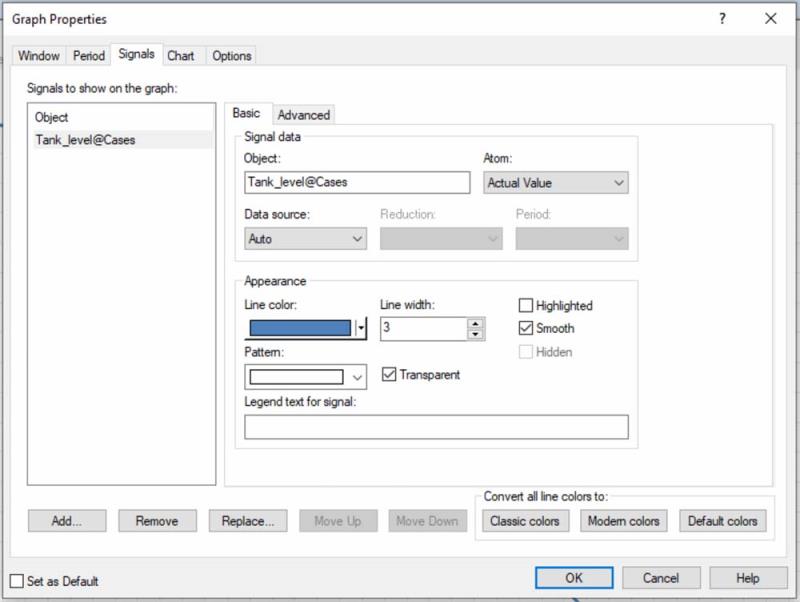
Signals tab
On the Basic sub-tab you can:
See also "Add signals to a graph" for instructions of 'How to'.
On the Advanced sub-tab you can:
-
Select to display the Y-axis for the signal.
-
Define which value limits to apply to the signal e.g. Automatic, with or without zero, limits from objects or user-defined fixed.
-
For analog signals, you can also select whether or not to display defined alarm limits (if any) for the actual value signal in the graph, and in which color.
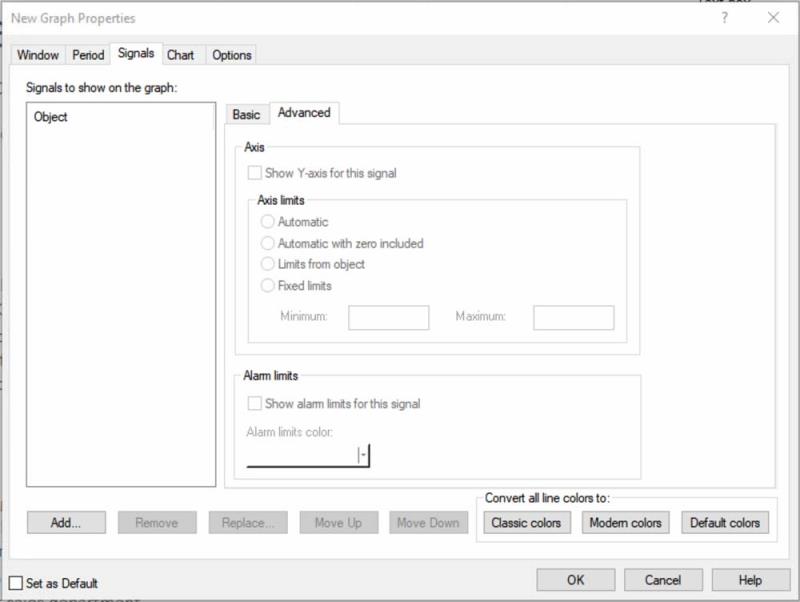
Chart tab
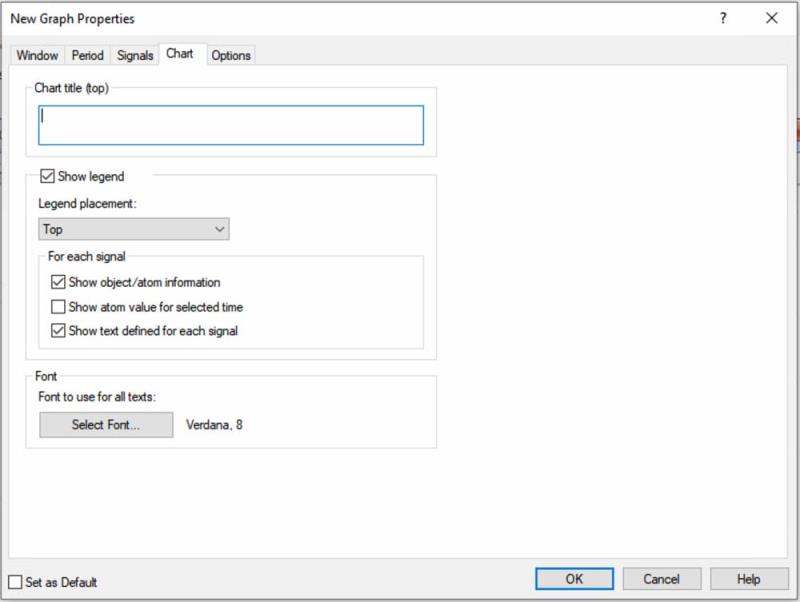
On this tab page you can:
-
Define the title of the chart
-
Select to show the legend and define its position
-
Select the signal legend properties such as object/atom information, atom value and text
-
Select the font properties for all texts
See also "Define chart title and legend text options" for instructions of 'How to'.
Options tab
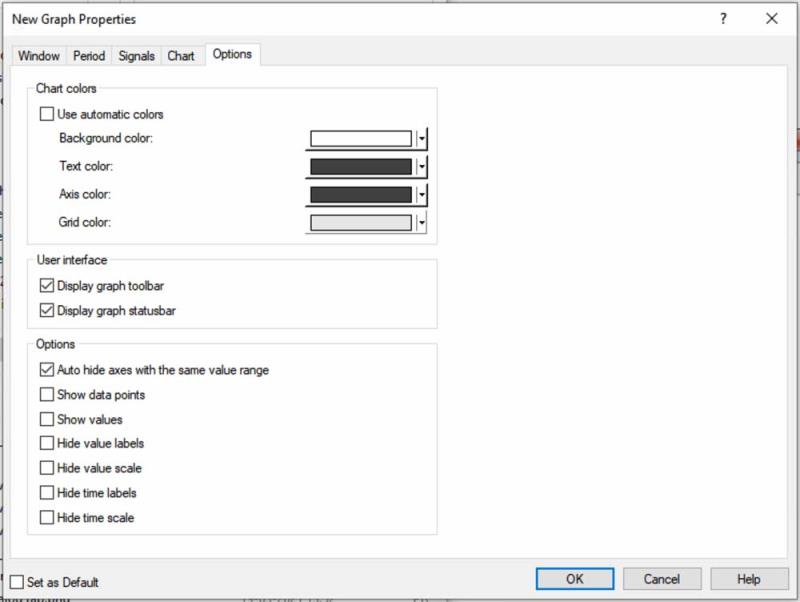
On this tab page you can:
-
Define colors for the graph elements:
Background color
Text color
Axis colors
Graph grid color
-
Display the graph toolbar
-
Display the graph status bar
-
The Options sub-group allows you to select if you want to show or hide e.g. axes with same value range, data points, values, value and time labels and scales.
See also "Define graph colors, user interface and other options" for instructions of 'How to'.
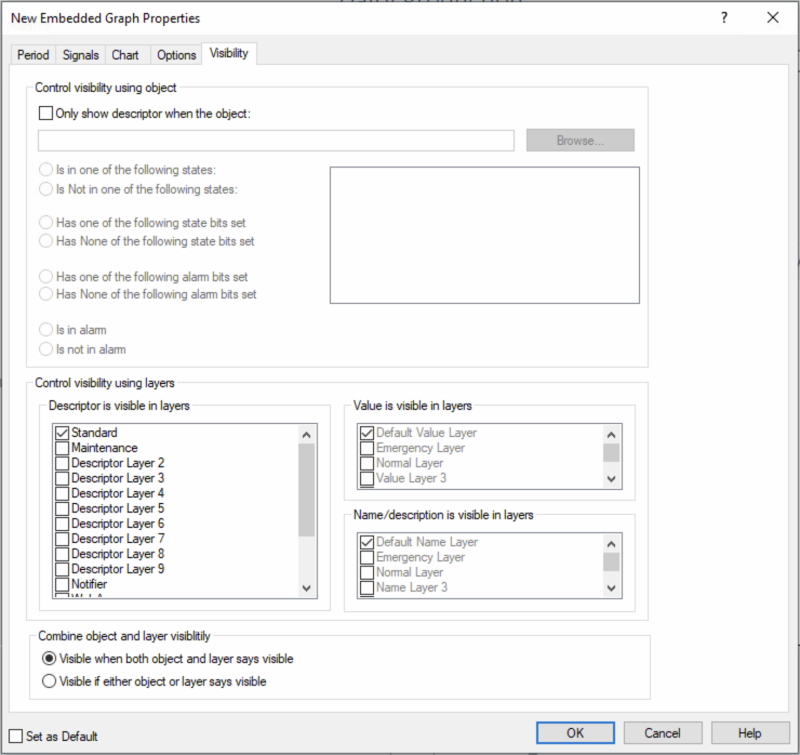
Visibility tab
Embedded graphs only
On this tab you define visibility parameters for an embedded graph:
-
Define when and how the graph will be shown in a diagram.
-
If the graph is only visible under certain conditions such as states or alarm.
-
Define how to display layers.
See also "Define the visibility of embedded graphs" for instructions of 'How to'.
Set as default checkbox
At the bottom of all tabs in the Properties form you can:
Use Set as Default if the graphs you create share many common properties.
See Also
"What are Graphs?"
"Create a new graph in a separate window"
"Create an Embedded Graph"
"Create and edit an Embedded Graph Basic"
"The Graph Toolbar"
"The Graph Status bar"
"Set as Default"
"Popup diagrams in a multiple screen environment"
"Find an object by name or description"
 .
.

