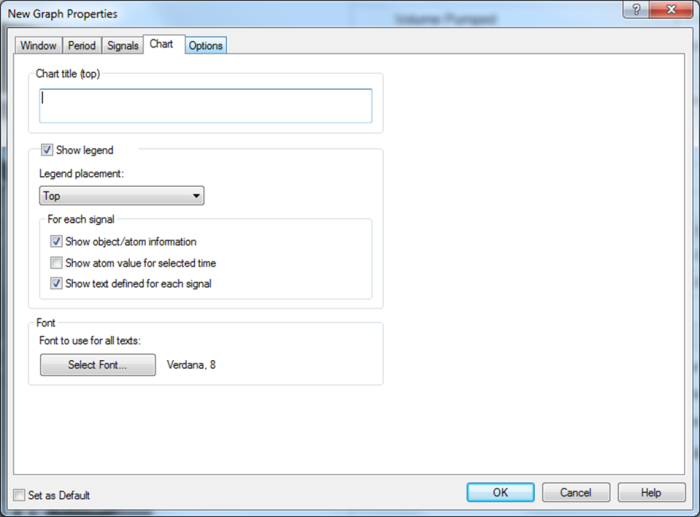
You can set a chart title for your graph. A chart title identifies the graph to the operator and can be displayed at the top of any type of graph. The chart title is also included when the graph is printed or saved (window- and operator graphs only).
Additionally, you can define the placement and composition of the signal legend as well as define whether or not to display any signal legend texts defined on the Signals tab.
For an Embedded Graph, displayed in a diagram, right-click on the graph and select Properties…
Note that properties for an Embedded Graph Basic are organized differently and with fewer options, ref. the "Create and edit an Embedded Graph Basic".

In the Properties form -> Chart tab:
Enter a Chart Title (can be left out for embedded graphs displayed in small format). There are no limitations re. number or type of characters. It can be different from the graph name and/or description, used to display in the window of stand-alone graphs and in the graph menu.
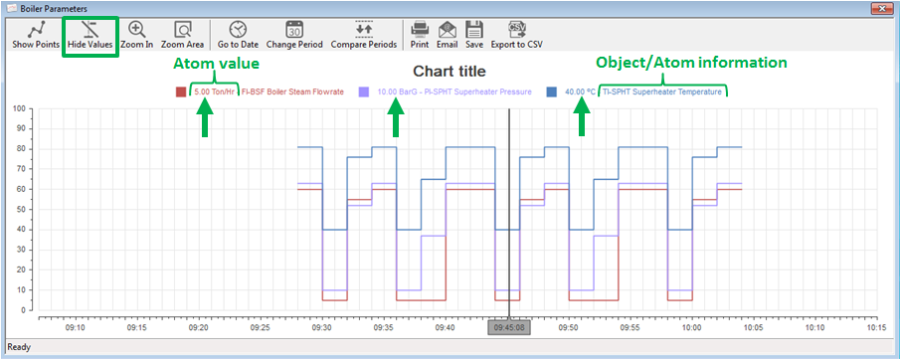
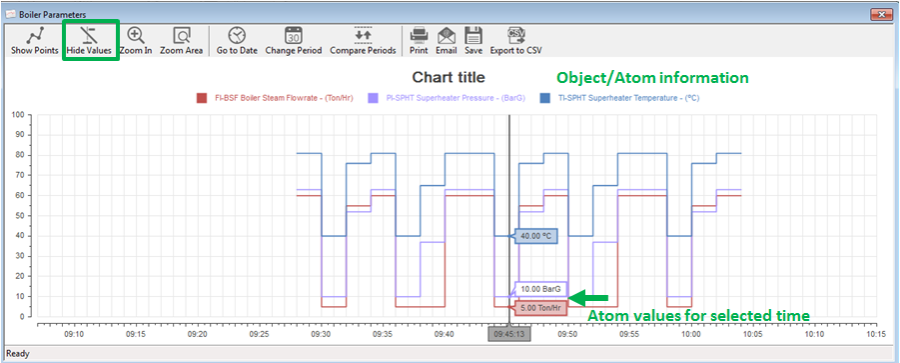
Select the Show atom value for selected time if you want to display the atom value in the signal legend (when the Show value button has been activated). This setting is applied to all signals in the graph.

If you do not select this box, the value indicator used to display atom values will be shown next to the signal lines.

Select which Font to use for all texts including style and size.
If you want to set up additional graph properties, click one of the other tab pages to continue graph set up:
You can set the present general graph properties as the default parameters for all future graphs by selecting the Set as Default check box. Note that individual signal properties such as color of signal lines and alarm limit lines etc. will not be saved as default.
In the Embedded Graph Basic form chart title is defined in the General tab, and legend text font is defined in the Objects tab.
See Also
"Set graph properties as default values"
"Create a new graph in a separate window"
"Define the visibility of embedded graphs"
"Create and edit an Embedded Graph Basic"
"Connecting objects to each other"
"Reference a graph from a symbol"