Open topic with navigation
Create a new graph in a separate window
You can create a new graph window for a stand-alone graph, which is not embedded in a diagram, or edit an existing graph window in the Definition module.

To create a new graph window:
-
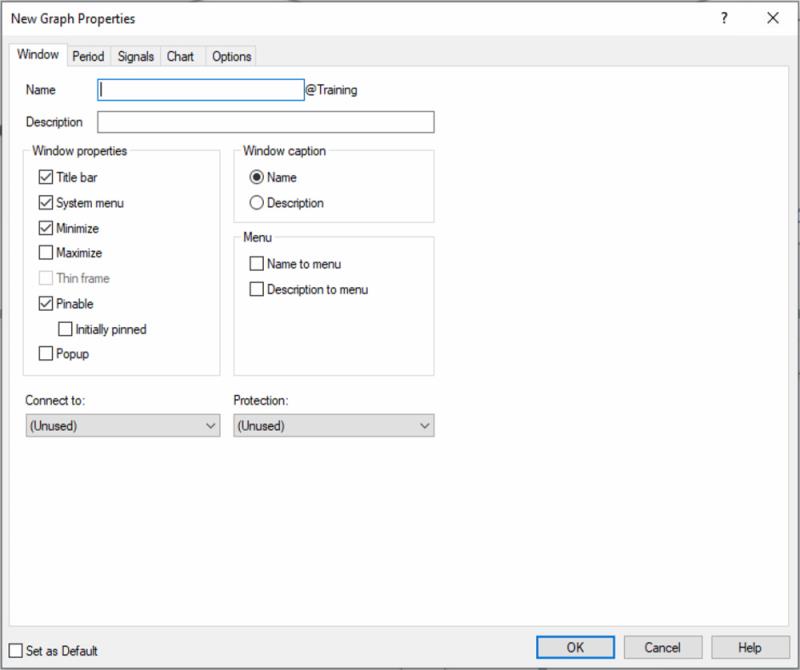
In the Definition module, click Graph > Create to open the Graph Properties form.

- In the New Graph Properties form > Window tab:
- In the Name field: Enter a unique name for the graph. Graph names are under the same restrictions as other IGSS objects and are limited to 30 characters with additional restrictions to what kind of characters are valid in an object name - see "Object Naming Rules".
To display the name in the title bar of the graph window, select the Name check box in the Window Caption group.
- In the Description field: Enter a description of the graph. You can select to display the graph description instead of the graph name when making the graph accessible for operators.
To display the description in the title bar of the graph window, select the Description check box in the Window Caption group.
- In the Window Properties group:
- Select the Title bar check box if you want to display the title bar in the graph window.
Select the System Menu check box if you want to display the system menu in the graph window.

NB! The System Menu check box has to be selected if you want to be able to select the Minimize, Maximize and Pinable check boxes.
- Select the Minimize check box if you want to enable operators to reduce the graph window to an icon.
- Select the Maximize check box if you want to enable operators to maximize a reduced or minimized the graph window to full screen.
Select the Thin frame check box if you want it to be displayed with a very thin frame around instead of the standard thicker Microsoft frame.
To be able to select Thin frame you first have to disable the Title bar option, which will make the graph title at the top left corner disappear. At the same time the System menu, Minimize, Maximize and Pinable options automatically disappear. This means that you can no longer re-size or close, and it will remain in the same position.
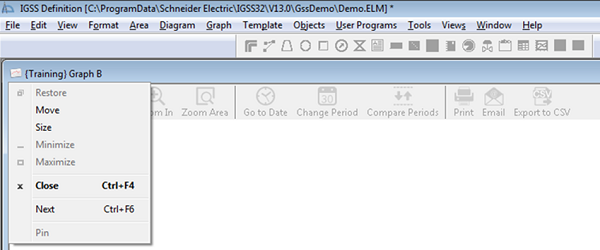
- Select the Pinable check box if you want to enable operators to fix the diagram permanently on the screen. The Pinable check box is only accessible when the System Menu check box is selected. The Pinable property is activated and de-activated on the icon in System menu in the upper left corner of the graph by selecting either Pin or Unpin. The graph window will not be initially pinned when opened in the Definition module.
- Select the Initially Pinned check box if you want to pin the graph window to the project by default when the diagram opens in the Supervise module.
The Initially Pinned check box will only be accessible if the Pinable check box has been selected .
- Select the Popup check box if you want to open the graph window in the same screen as the referencing control.
-
(Optional) In the Window Caption group:
-
Select whether you want the Name or the Description to be shown as graph title (caption) in the top left corner of the window.
-
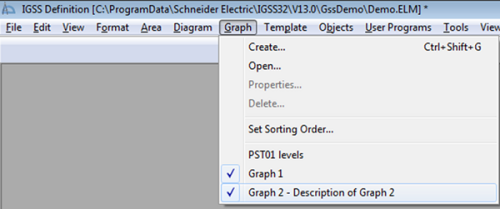
In the Graph menu group, select one or both check boxes if you want to have the graph’s name and/or description shown in the Graph menu (shown below) of Definition and Supervise.

- (Optional) In the Protection field, select the Protect object you want to assign to the graph window if you want to use IGSS Object Level Protection security feature to restrict operator access to graphs.
- (Optional) In the Connect to field, select another graph you want open automatically when this graph is opened.
-
(Optional) Select the Set as Default check box if you want the graph properties you select for this graph to be used as default, when you create new graphs. You can always adjust the properties.
You can set the present general graph properties as the default parameters for all future graphs by selecting the Set as Default check box. Note that individual signal properties such as color of signal lines and alarm limit lines etc. will not be saved as default.
After you have set up the graph window parameters, you must define the default graph period, colors, chart and interface options plus add signal(s) to display in the graph in the different tabs of the New Graph Properties form. Explore the links below for more information on how to do this.
See Also
"What are Graphs?"
"Create an Embedded Graph"
"Set graph properties as default values"
"Graph Properties Form"
"Change graph properties"
"Protect a graph"
"Delete a graph"
"Connecting objects to each other"
"Reference a graph from a symbol"
"Object Naming Rules"


