When creating any type of graph, you can add one or more signals to the graph. A signal is data input to the graph and is usually an Analog atom, but can be atoms from Digital, Counter and/or Table objects.
A graph can contain up to several signals, although it is recommended to keep the number of displayed signals as low as practically possible to improve overview and avoid cluttering.
Signals from State and Command atoms from Digital objects are placed at the bottom of the graph.
Operators can add or remove graph signals in the Supervise module as well as hide and emphasize individual signals.
For an Embedded Graph, displayed in a diagram, right-click on the graph and select Properties…
Note that properties for an Embedded Graph Basic are organized differently and with fewer options, ref. the "Create and edit an Embedded Graph Basic".

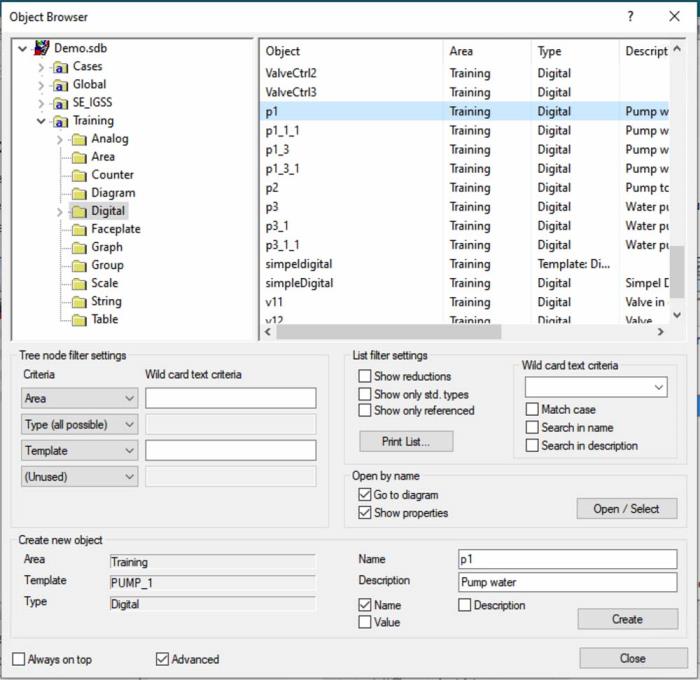
Click the Add button on the Signals tab to open the Object Browser form.
In the left pane of the Object Browser form, expand the folder and select the object type folder (Analog, Digital, Counter, Table) of the object you want to create a signal for.

In the right pane of the Object Browser form, select the object you want to create a signal for, click Open/Select to add the selected object and close the Object Browser form.
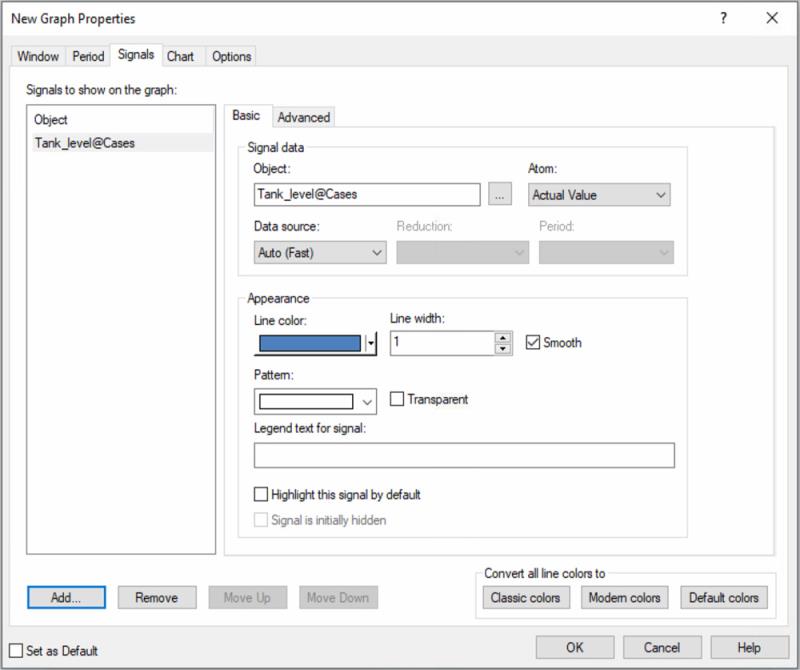
In the Properties form -> Signals -> Basic tab:
In the Atom field, select which atom you want to display in the graph. Only atoms that have been enabled on the object will be shown in the drop-down list.
Select a Data Source for the graph signal:
Auto: If you select Auto, IGSS will automatically populate the graph lines based on the quickest and most readily accessible data set (Log and/or Reduced). Graph line detail will be rough to begin with and then improve as the graph continuously loads data.
Auto: The fastest and best data are retrieved from all reduced data files - BCL and HDM (HourDayMonth) - to draw the initial graph lines.
Base: BCL files are used to draw the graph lines.
Minutes, Hour, Day and Month are used.
If you select a period which does not contain reduced data for the atom, the graph will not be drawn.
Online: The graph will only load online (live) process data. If an atom (signal) is not receiving online data, the graph line will not display anything for that signal. If the selected atom has not been set up to store object data in the data source specified (LOG or BCL), nothing will be displayed in the graph for that signal.
Note you cannot select a data source type which the selected atom is not set up to store.
In the Appearance group you define:
Line color: Select the color you want to represent the signal line in the graph. At the bottom of the Graph Properties form you can select among various color schemes:
Classic colors are used in IGSS version 11 and older and are brighter and sharper than ...
Modern "flat" colors, which are less shiny, and used in IGSS version 12 and newer. Each set of Classic colors are mapped to a set of Modern colors, and you can convert the color schemes back and forth. In the color palette you have a choice of modern and standard (classic) colors, and you can mix your own colors.
Default colors are a number of pre-selected modern colors that will be used as default line colors if you don’t select any others. Line colors are: Blue for the first signal, the following are red, green, light blue, orange, purple, grey, brown etc.
Highlight: Select if you want the signal’s graph line and axis to be bold.
The operator can remove signal highlights at any time by right-clicking the signal, selecting Properties and remove the check mark for Highlight.
Smooth : Removing the checkmark for 'Smooth' will display the graph in hard pixels which makes it easier to read thin graphs showing a dense amount of curves/data.
Pattern: Select a pattern for the part of the graph below the signal line.
Transparent: Select if you want the graph’s pattern to appear transparent.
In the Legend text for signal field, enter your own text to use for the signal legend. The text will be suffixed to the automatic signal legend (object/atom name).
You can decide whether or not to show the automatic signal legend on the Chart tab.
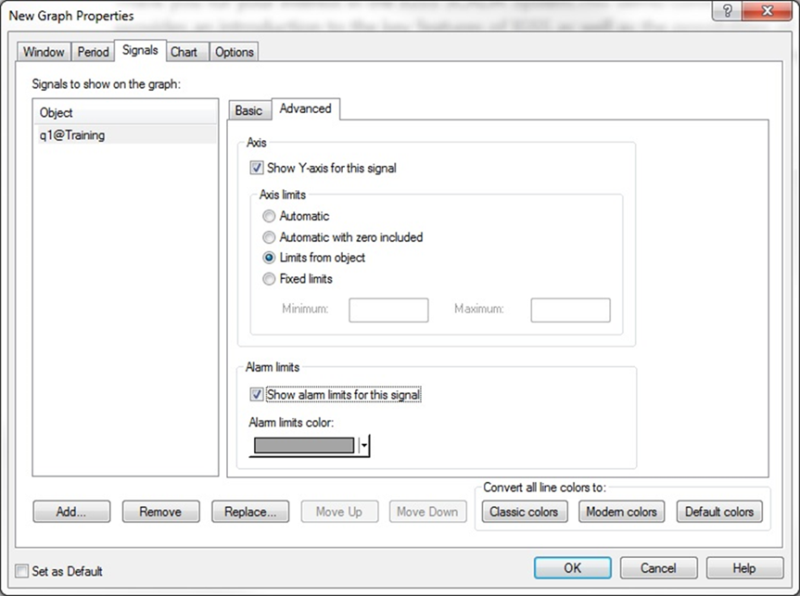
In the Graph Properties form -> Signals -> Advanced tab, for each signal:
Note that the graph will only display alarm limits for the alarm type(s) selected in the Object properties form’s Atom Mapping tab i.e. one or more of the following options: High alarm, Low alarm, High limit and Low limit. The graph will show the limit value(s) defined in the Object properties form’s Analog tab.

You can rearrange existing signals, replace them with another signal and remove existing signals from the list by using the Add..., Remove, Move up, Move down buttons.
Click the OK button to save and close the Graph Properties form.
If you want to set up additional graph properties, click one of the other tab pages to continue graph set up.
You can set the present general graph properties as the default parameters for all future graphs by selecting the Set as Default check box. Note that individual signal properties such as color of signal lines and alarm limit lines etc. will not be saved as default.
In the Embedded Graph Basic form , the graph signals are defined in the Objects tab.
See Also
"Set graph properties as default values"
"Create a new graph in a separate window"
"Define the visibility of embedded graphs"
"Create and edit an Embedded Graph Basic"
"Connecting objects to each other"
"Reference a graph from a symbol"
"Show alarm limits (Analog objects only)"