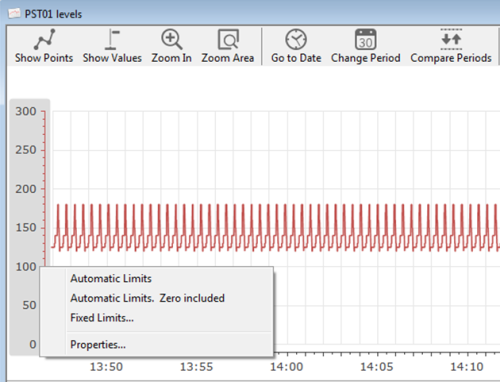
Use the Y-axis property menu to decide how the upper and lower limits of the Y-axis are to be defined – automatic or with fixed, pre-defined limits – as well as to open the Graph Properties form.

In the graph area, right-click a Y-axis to open the Y-Axis property menu. Which and how many items the menu contains depend of the previous selections made.
This menu does not exist for the Embedded Graph Basic, which is operated differently – see separate help page.
Stand-alone Graphs and Operator Graphs must be opened in a graph window. Embedded graphs are permanently displayed as part of a diagram.
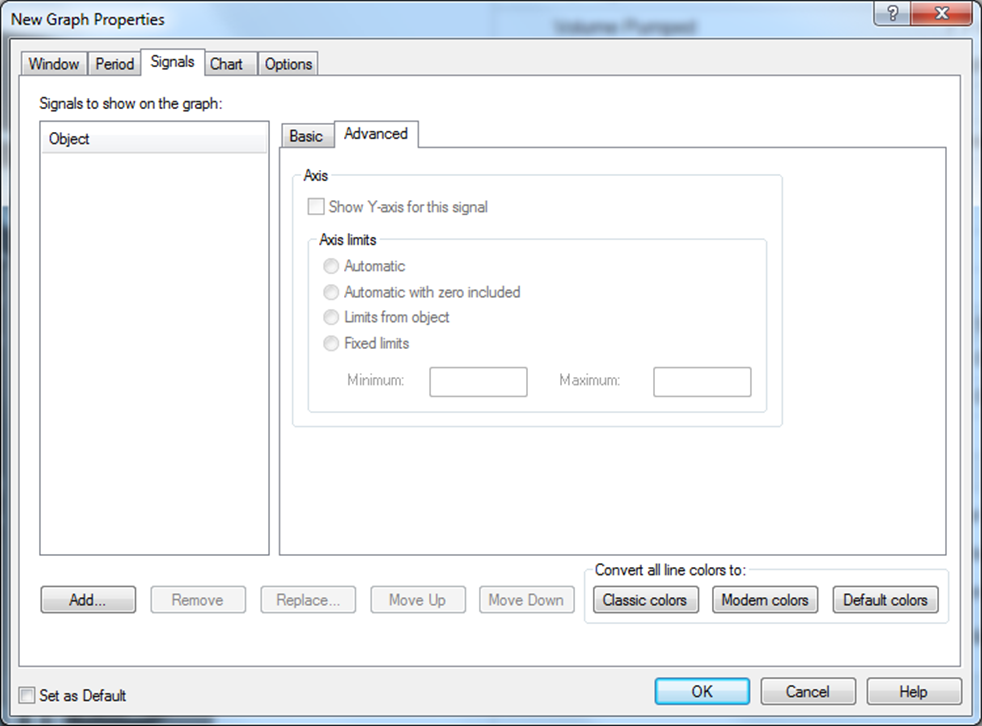
The Y-axis of the signal must be displayed in order to be able to right-click on a Y-axis. You can decide if you want to show the Y-axis or not in the Graph Properties form:
Right-click in the graph to get the Graph Property Menu
Select Graph Properties > Signals tab > Advanced sub-tab
Set (or remove) a check mark in the box Show Y-axis for this signal

|
Menu option |
Description |
|---|---|
| Automatic limits |
Select this option if you want the upper and lower limits of the Y-axis to be set automatically based on the lowest and highest limits in the signal object data selected for display in the graph. |
| Automatic limits. Zero included |
As above but with zero displayed on the Y-axis. |
| Fixed Limits |
Select this option to open the Graph Properties form > Signals tab > Advanced sub-tab where you can define you own upper and lower limits of the Y-axis in the Minimum and Maximum fields. |
| Properties |
Select this option to open the Graph Properties form. Use the New Graph Properties form to define the graph period, the object atoms and appearance of the graph line, the data source to be displayed in the graph, the graph title and the font properties for all graph texts. You can also set up the graph legend properties and chart colors as well enable display of the graph toolbar and status bar. |
See Also