Show alarm limits (Analog objects only)
To make it easier for the operator to see if the actual value signal of an analog object is within or outside any eventual defined alarm limits, it is possible to display these in a trend graph.
If the system designer has predefined the graph to show alarm limits in the Definition module, the limits will be visible as default. If not, the operator can decide to show the limits temporarily in the Supervise module until the window graph or diagram with embedded graph is closed.
Note that the graph will only display alarm limits for the alarm type(s) which the system designer has selected in the Definition module’s Object properties form i.e. one or more of the following options: High alarm, Low alarm, High limit and Low limit. The graph will show the limit value(s) defined in the Object properties form.
The Show limits feature only works for Actual value signals, and will typically be used for one or two signals only at a time.
Below is valid for all types of graphs except Embedded Graph Basic, which works differently – see separate help page.

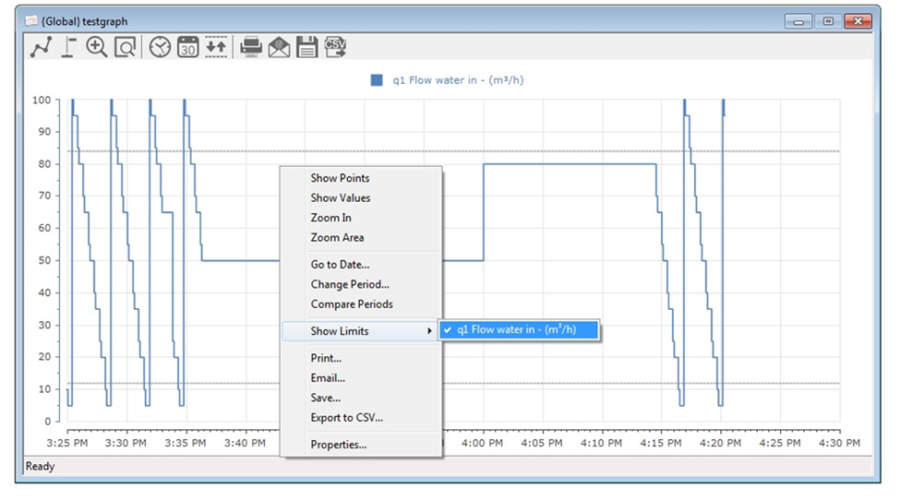
Graph displaying the high and low alarm limits (grey dotted lines) in addition the blue Actual value signal of the “q1 Flow water in” analog object. Alarm limits can be selected and removed in the Graph property menu (shown) or the Signals property menu.
Show alarm limits for one or more Actual value signals
The operator can at any time decide whether or not to display alarm limits in the graph.
Right-click the signal legend text of the Actual value signal of the analog object for which you want to show alarm limits and select Show Limits. The graph will now display horizontal dotted lines for all defined alarm limits.
Remove alarm limits
To remove alarm limits from a signal, right-click the relevant signal legend and select Remove limits.
Right-click the graph to show the Graph Property menu. Mouse-over Show Limits and select the Actual value signal of the analog object for which you want to show alarm limits.
The graph will now display horizontal dotted lines for all defined alarm limits. Repeat to show alarm limits for other actual value signals of analog objects.
Remove alarm limits
To remove alarm limits from a signal, right-click the graph and in the Graph Property menu mouse-over Remove limits and select the signal for which you want to remove the alarm limit(s) from the list. Objects with Show limits activated have a check mark in front.
Repeat to remove alarm limits from another signal.
Define the colors of the alarm limit lines
The color of the alarm limit lines will be shown in grey as default, or in the color selected by the system designer in the Definition module. The operator can change the limit lines’ color temporarily until the window graph or diagram with embedded graph is closed.
To change the color of the alarm limit lines:
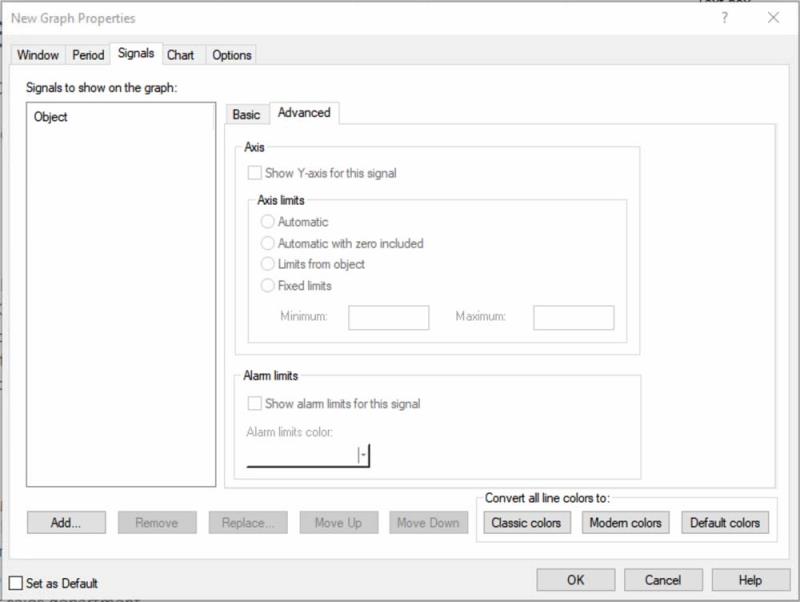
- Right-click in the graph and select Properties …
- In the Graph Properties form’s Signal tab’s left pane, select the relevant analog object with the Actual value atom
- Select the Signal tab’s Advanced tab
- In the Alarm limits group, select the desired color for the dotted limit lines
-
Here, you can also select whether or not to Show alarm limits for this signal

Note, that the alarm limit line color selected in the Supervise module will only be valid temporarily until the graph is closed. When opened again, the predefined color will be shown.
If you save the graph as an Operator graph, the new defined color will be saved along with the other graph properties.
See Also
